Difference between revisions of "Task Statistics Console"
From PresenceWiki
| Line 9: | Line 9: | ||
* Maximum run time (milliseconds) | * Maximum run time (milliseconds) | ||
* Average time (milliseconds) | * Average time (milliseconds) | ||
| + | |||
| + | To launch the Task Statistics console select Task > Task Statistics from the Administration client [[Menu Options|Menu]]. | ||
Please note that statistics recording must be enabled in the [[New Task Dialog|Task Properties Dialog]]. | Please note that statistics recording must be enabled in the [[New Task Dialog|Task Properties Dialog]]. | ||
Revision as of 09:03, 6 July 2010
| Administration Client > Task Statistics Console |
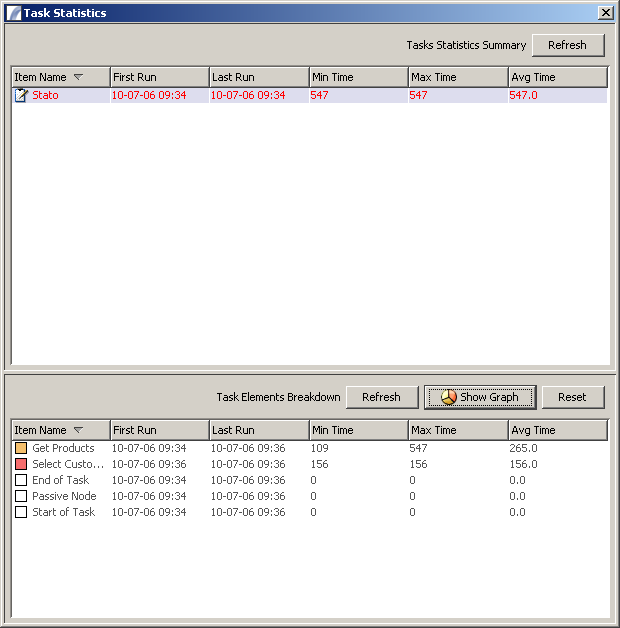
The Task Statistics console displays the following metrics about a Task's Nodes to enable performance tuning:
- First run time
- Last run time
- Minimum time to run (milliseconds)
- Maximum run time (milliseconds)
- Average time (milliseconds)
To launch the Task Statistics console select Task > Task Statistics from the Administration client Menu.
Please note that statistics recording must be enabled in the Task Properties Dialog.
http://www.international-presence.com/wikidocs/images/task_statistics.png
Above is the main console. Clicking on a Task name in the top pane causes the Task Elements Breakdown table (below) to reflect the selected Task. These items can be sorted by clicking on the column header.
- Refresh (Task Statistics Summary) - refreshes the list of Tasks that have statistics available
- Refresh (Task Elements Breakdown) - refreshes the statistics for the Task selected
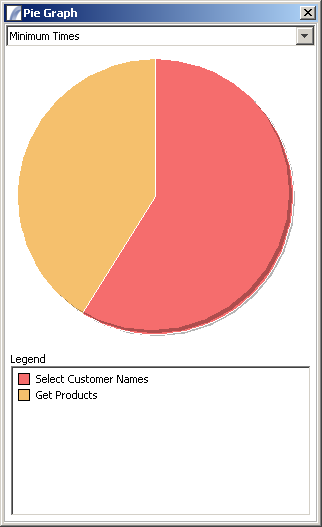
- Show Graph - Displays a pie graph showing the ratio of average, minimum and maximum times for the Task Elements (see below).
- Reset - Clears all statistics associated with the selected Task.
http://www.international-presence.com/wikidocs/images/task_statistics_graph.png
Architecture > Administration Client > Task Statistics Console
| Task Explorer | Resources Explorer | Task Designer |
| Menu Options | Toolbar Items |